Raghad Alotaibi

This portfolio showcases the data science projects I've recently completed by using machine learning algorithms to various business and real-world problems through computer programming languages including Python and R.
Check My Articles on Medium.com
View My LinkedIn Profile
Employees’ Attrition Prediction Model
A team project conducted to predict IBM employees attrition by implementing six learning models.
Motivation Many workplaces are considered as a second home for most employees due to the duration they spend at work. Successful workplaces consider the loss of their employees as bad as losing customers, if the rate of employees’ resignation increased over a short period of time. For that, the HR department always consider employees’ attrition as a bad indicator of the environment.
Problem definition Employees’ attrition is considered one of the toughest problems the HR department could face. Detecting the cause of such problem and analyzing the affecting factors can lead to a reasonable solution and furthermore predict the attrition of the employees. The main purpose of this study is to build a model that would predict the employees’ attrition.
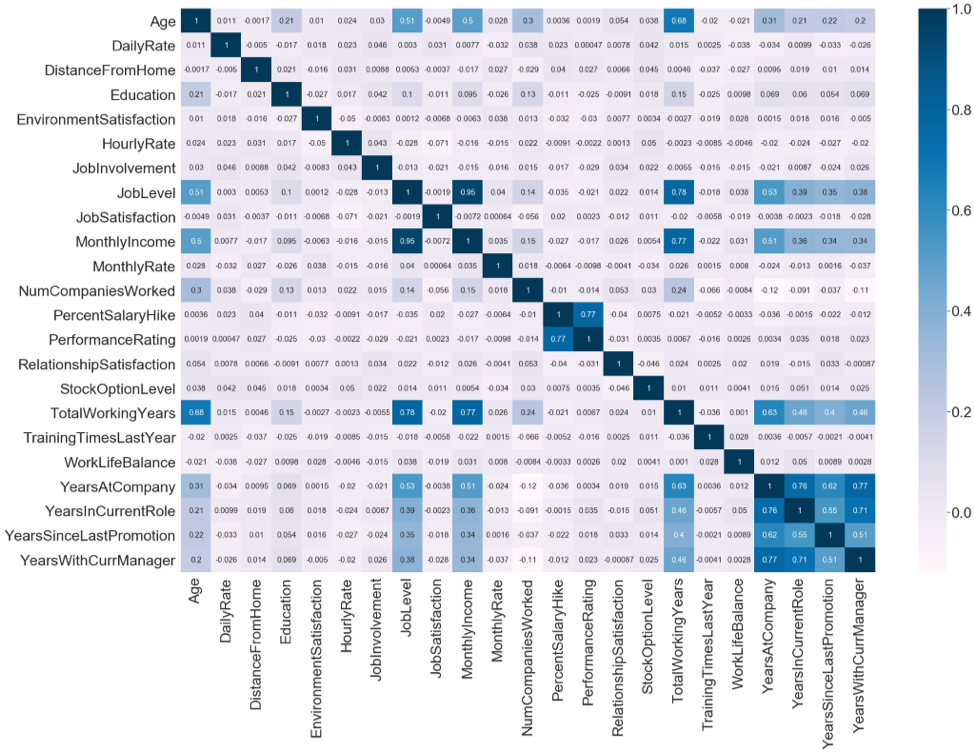
Exploratory Data Analysis The dataset presents employees survey of IBM HR employee attrition and performance from Kaggle website. It contains 1470 observations and 35 features. A data quality report was generated to view the data types, missing / present values and irregular cardinalities. A heat map was illustrated to view the correlation between the features and DataFrame.Describe() function was applied to calculate the central tendency measures.

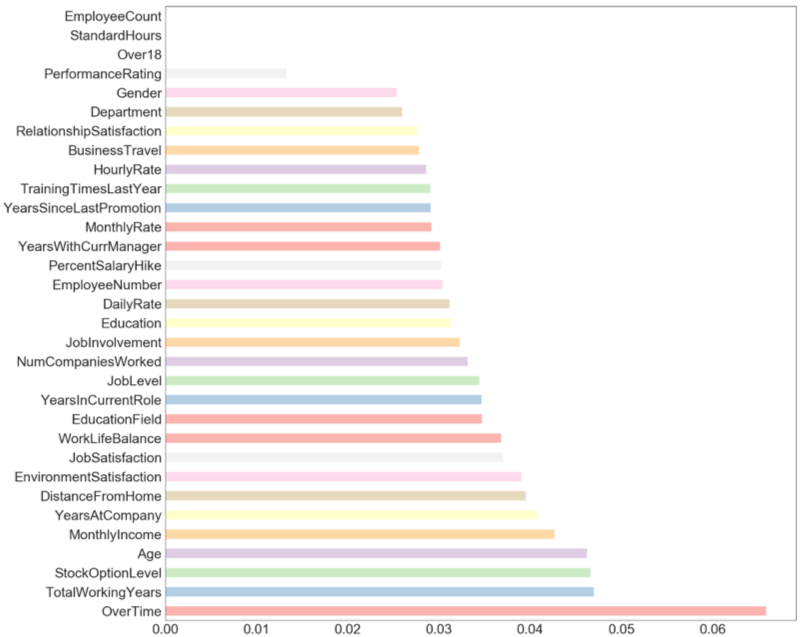
Feature Engineering and Categorical Encoding The exploratory analysis proposed a lead to features with single cardinalities: over18, employee count and standard hours which do not produce values, therefore were excluded. Then, extra tree algorithm was applied as feature selection method. The final step was mapping the categorical features into numerical values dynamically using Pandas.DataFrame.Replace().

Implementing Machine Learning models
Splitting the data into training and testing is mandatory to apply the learning models, which was done by:
- Holdout method: the simplest type of cross validation, which was used to separate the dataset into training and the testing sets by the train_test_split() function.
- k-fold cross-validation: separates the dataset into train and test sets by splitting dataset into k consecutive folds by the cross_val_score() function.
After preparing the data, 6 learning models were applied:
1- Gaussian Naive Bayes
A supervised learning algorithm based on Bayes’ theorem with the naïve assumption of conditional independence between every pair of features given the value of the class variable.
2- Linear-kernel SVC
SVC represents frontier which best segregates the two classes by hyper-plane/line. It has various options available with kernel, and linear is the applied type in this project since it produces the highest accuracy on this data.
3- Decision tree
DT split the data by using Entropy which control how a DT decides to split the data and draw its boundaries. The depth of the DT that has been applied in the project is maximum 3.
4- K-Nearest Neighbor
KNN algorithm is a type of supervised ML algorithm that calculates the distance of a new data point to all other training data points. The type of distance that has been used in this project is Minkowski distance and the number of neighbors was 4.
5- Neural Network
A neuron in a neural network is a mathematical function that collects and classifies data according to a specific architecture. 100 neurons in one hidden layer has been applied.
6- Random Forest
Random forest is an ensemble learning method for classification. It has been applied in the project to adds additional randomness to the model while growing the tree. Only a random subset of the features was taken into consideration by the algorithm for splitting a node. By this the accuracy of the model was increased compared to decision tree model.
Results
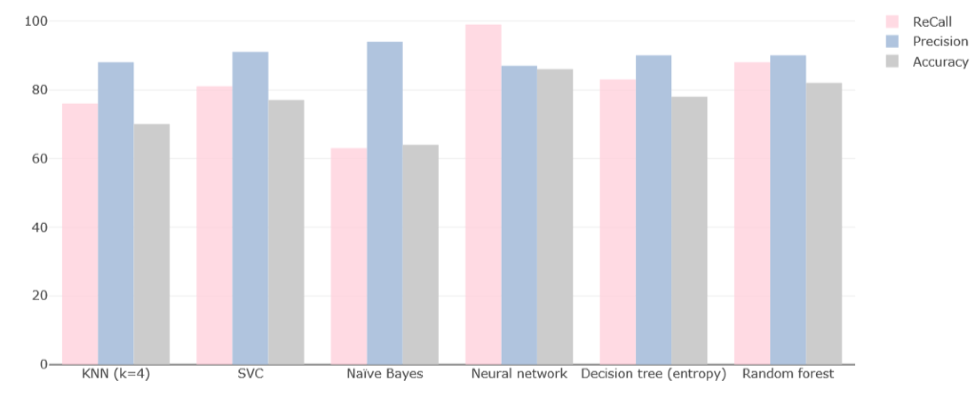
The following chart present the Recall, Precision and Accuracy values for the applied models.

The follwing table shows the accuracies for the applied models per k-folds equal 3 and 10 in the cross validation method.
| Algorithms / Accuracy per K-folds | CV=3 | CV=10 |
|---|---|---|
| KNN (k=4) | 73 | 78 |
| SVC (rbf) | 52 | 53 |
| Naïve Bayes | 68 | 73 |
| Neural network | 47 | 58 |
| Decision tree | 45 | 76 |
| Decision tree (entropy) | 40 | 75 |
| Random forest | 61 | 88 |
Conclusion
Ultimately the project constructed a predicting model to predict employee attrition, by implementing six learning models where the highest are: Decision Tree and Random forest. The accuracy of the models with cross validation lies between 76% and 88%, while the accuracy without cross validation are between 72% and 85%. In conclusion, recommendation to the organization is that it can reduce the rate of attrition by decreasing the overtime for the employees, enhance the monthly income and provide increment in the transportation allowance. By this the organization decrease employees’ attrition.